Final Year Project: Mining of Transportation Data
1. Reason for doing this project
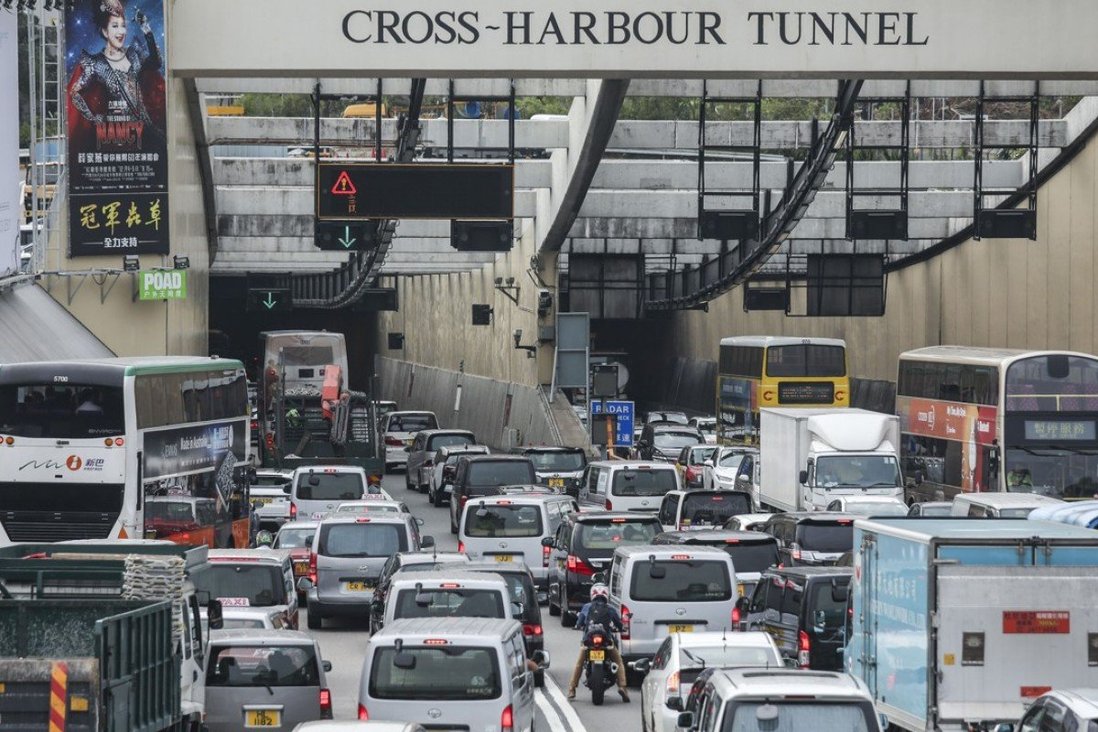
Traffic Congestion is a typical problem in Hong Kong. During the peak hours in Cross Harbour Tunnels, there are numerous cars moving at a slower speed. When there are some accidents happening in MTR (i.e a Metro system in Hong Kong), the situation becomes worse due to more people taking the bus to instead. The objective of this project is to analyze the mobility trace data of buses using machine learning and optimize the route planning.
Here is the key steps for implementation of this project:
- Identify the problem from the dataset
- Verify the weighted bus network
- Simulation
2. Techniques Used
2.1 Powershell for Extracting data
The mobility trace data recorded GPS location per minutes of each routes of KMB (one of the major bus company in Hong Kong). The aim is to extract the departure time and arrival time.
Here is the data structure of mobility trace data:
| Data Info | Description |
|---|---|
| bus_no | The bus number used in each route. |
| log_date | The date that logged the mobility traces. |
| log_time | The time that logged the mobility traces. |
| gps_pos_lat | The GPS position of latitude |
| gps_pos_long | The GPS position of longitude |
| Route Route | Number of the bus. |
| DeptFr | The bus departure from. |
The extracting procedures:
-
Data will be separated from its route number.
-
Change the column order to “Route”, “DeptFr”, “bus_no”, “log_date”, “log_time”.
-
For the “log_time”, it will be broken into the starting time and ending time parts.
- Comparing the following criteria to extract each shift bus in the same route
- Departure Location
- Bus number
- Date
- Time Difference within 20 mins
- Delete abnormal data:
- Case 1: The location does not change in GPS position
- Case 2: Part of the journey recorded
- Case 3: Over record
- Export to CSV file and calculate the duration
2.2 Machine Learning for Classification and Regression
Scikit-learn is a useful library for classification especially for K - Nearest Neighbour (K-NN) and Support Vector Machine (SVM)
The reason why using KNN is to classify the travelling time for each routes belong to peak hours or non-peak hours. To classify the data for training, the lower quarter will be regarded as the sample of normal travelling time while the higher quarter data will be regarded as the sample of congestion period. For the remaining, it is used for testing to classify its group. For k-nearest neighbours, it depends on the sample size. Here is the working flow:
First, 30% of data will be labelled as peak-hours and non-peak hours
import csv
def loadDataSet(filename,training=[],testset=[]):
    with open(filename, 'r') as csvfile:
        lines = csv.reader(csvfile)
        dataset = list(lines)
        for x in range(len(dataset)):
            for y in range(3):
                if dataset[x][y] == "":
                    testSet.append(dataset[x])
                elif y == 2:
                    trainingSet.append(dataset[x])
Second, calculate the Euclidean Distance between the data
import math
def euclideanDistance(in1, in2, length):
    distance = 0
    for x in range(length):
        distance += pow((float(in1[x])-float(in2[x])), 2)
    return math.sqrt(distance)
Third, get Neighbors
import operator
def getNeighbors(trainSet, testInstance, k):
    distances = []
    length = len(testInstance)-1
    for x in range(len(trainSet)):
        dist = euclideanDistance(testInstance, trainSet[x], length)
        distances.append((trainSet[x], dist))
    distances.sort(key=operator.itemgetter(1))
    neighbors = []
    for x in range(k):
        neighbors.append(distances[x][0])
    return neighbors
Then, get Response
import operator
def getResponse(neighbors):
    classVotes = {}
    for x in range(len(neighbors)):
        response = neighbors[x][-1]
        if response in classVotes:
            classVotes[response] += 1
        else:
            classVotes[response] = 1
    sortedVotes = sorted(classVotes.items(), key=operator.itemgetter(1), reverse=True)
    return sortedVotes[0][0]
Finally, output the result
Train: 971
Test: 592
2.3 Simulation tools
SUMO is a simulation tools for public transportation.
Here is the setup procedures:
- Build a road network topology
- Set up road trip information and prepare statistics file, trip.rou file and additional file.
- Run the simulation
- Obtain the results from the output files
Simulation Result
There are four cases to be simulated:
- Case A: Add more shift of bus routes in day with accidents
- Case B: Adjust number of bus stops
- Case C: Another route at peak hours
| Scenario | Description | Result |
|---|---|---|
| Case A | Bus and MTR are complement for passengers taking the transportation to their destination. When there are some accidents occurred in MTR, the bus routes covered the MTR Lines would be increased the number of shifts of routes to distribute the passengers from MTR to bus. As a result, the number of shifts will be increased in the simulation to show the effect. | It is showed a sufficient effect to shunt such a great amount of people in a short time by adding 6 routes. |
| Case B | As some bus stops difference are relatively small, those bus stops can be grouped together in order to minimise the bus stopping time for boarding and thus the total travelling time can be decreased. | Both peak hour and non-peak are reduced its duration. |
| Case C | Since KMB provide some special routes to serve in peak time, some route can be simulated to know if a new special route proposes. | 80% of the alternative routes are reduced the travelling time. |
Further Development
- Simulate more cases in Saturday and Holiday
- Consider the evening peak hours
- Use deep learning to predice traffic flow and arrival time to cope with serveral case
Awards
Here is the award attained from internal and external competition:
Third Class Award, Pan-Pearl River Delta Region IT Project Competition 2020
Technical Excellence Award, Department of Electronic and Information Engineering, The Hong Kong Polytechnic University