First Power BI Visualization: World Vaccination
Background
The no. of reported cases of COVID-19 is strictly increasing in the last few weeks. More and more people are going to have booster shots as per the government action. Meanwhile, some people are not fully vaccinated or even dose 1. Therefore, I have a fancy for understanding the fully vaccinated rate in the world and using Power BI to present it.
Where is data from?
In Kaggle, there are various types of data provided for users to analyze and predict. I got the vaccination data from there.
Implementation
- Import data to power query
- Read the data distribution and statistics
- Understand the structure
- Data cleaning: Remove unnecessary column and incorrect values
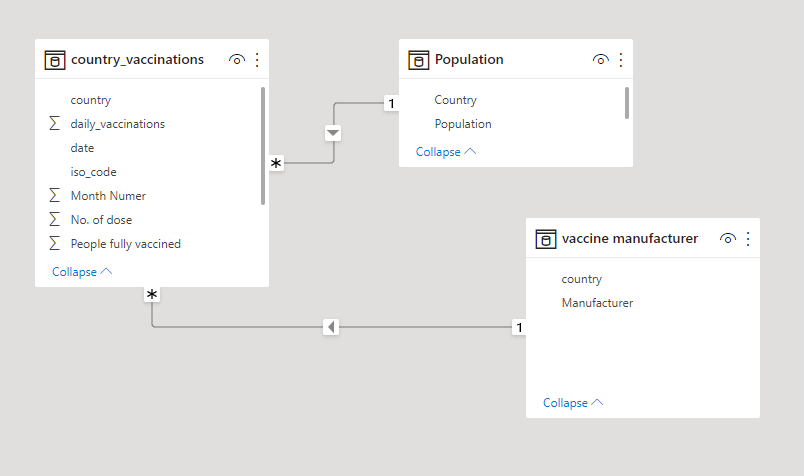
- Data Modeling: Create relationship between tables
Result
Difficulty Encountered
- The no. of people fully vaccinated in each row is the sum of each day and one of the goals is to identify the trend of fully vaccinated. Therefore, I need to subtract the value by date by creating two columns with unique values and subtract them.
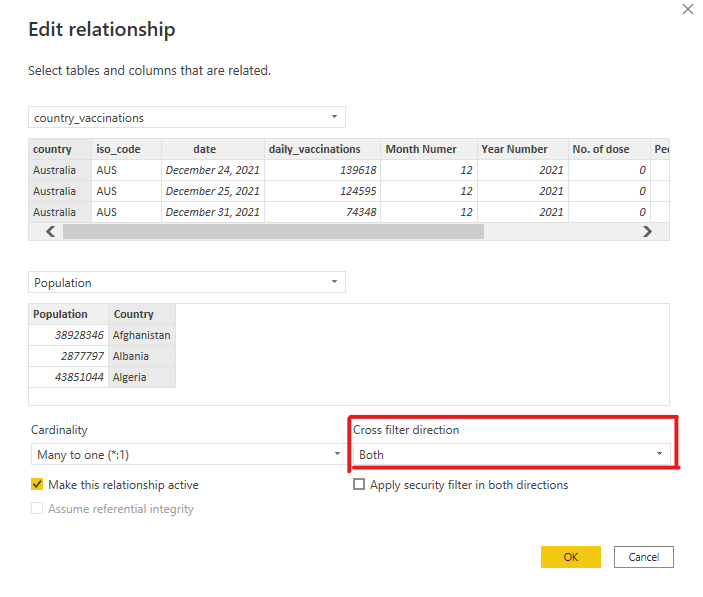
- The interaction between map and table does not work properly. Thus, I change the configuration of cross filter direction in data model.
Improvement
- Modify data modeling since cross filter direction with both direction will increase the performance when handling such data
- Further investigate the no. of people with fully vaccinated but with COVID-19 test positive